
Animal Adoption in Texas with Plotly
- Atharva Anil Dastane
- Oct 15, 2022
- 2 min read

Updated: Nov 18, 2022
Bringing a dog or a cat home often creates confusion whether to adopt or buy from a breeder. I live in Colorado(dog state) and asked many people having dogs whether to adopt or buy from a breeder. 90% of the people said they had adopted their pets instead of buying. It's much less expensive to adopt than purchase from a breeder.
So I tried answering some important questions regarding Adoption through my Exploratory Data Analysis.
Problem Statement
I would like to answer three important questions through this Report.
How do you measure the success of the animal shelter in terms of locating an animal and rescuing it as well as being surrendered by their owners from different counties ?
How has the pandemic influenced the adoption pattern in Austin?
Do older animals stay longer at the animal shelter and are less likely to get adopted?
Introduction The Austin Animal Center is the largest no-kill animal shelter in the United States that provides care and shelter to over 18,000 animals each year and is involved in a range of county, city, and state-wide initiatives for the protection and care of abandoned, at-risk, and surrendered animals. More info : https://www.austintexas.gov/department/about-austin-animal-center
Data Collection I collected data from Socrata API (https://dev.socrata.com/foundry/data.austintexas.gov/9t4d-g238). The Socrata Open Data API allows you to programmatically access a wealth of open data resources from governments, non-profits, and NGOs around the world. The data was extracted in JSON format. In order to avoid Throttling I wrote the data to a text file and downloaded it to my local system.
Libraries Used
Numpy, Pandas, Plotly
Plotly was used as it provides interactive graphs and plots.
Data Formatting
I read the data from a text file and converted it to a Dataframe.
We have two dataframes here :-
Intake - Dataframe containing all the Animal Intake information.
Outcome - Dataframe containing adoption details, fostering period, etc.

Data was not clean, so I did some cleaning and preprocessing.
Data Preprocessing and Cleaning
Removed Duplicate columns and Values
Dropped columns containing missing values which were not essential for my analysis
Formatted datetime column to extract Day, Month and Year
Correction and Normalization of some columns
Column Descriptions
animal_id - Primary key to distinguish animals
datetime - Date and time when the animals were rescued,surrendered and adopted,euthanized,etc.
breed - Breed of the animal
color - Color of the animal
sex_upon_intake - Sex of the animal(F/M)
intake_type - Was the animal owner surrendered, stray or public assistance.
age_upon_intake - Animal's age when it was surrendered or rescued
age_upon_outcome(in Months) - Age when animal left the center
Street - Street from where the animal was rescued or surrendered
City - City from where the animal was rescued or surrendered
Distance from Austin (in miles) - Distance of other counties from Austin
Intake_Month, Year and Day - Date when the animal taken in at the center
Outcome_Month, Year and Day - Date when the animal was adopted, euthanized, abandoned, etc
Answering Problem Statement Questions
1) How do you measure the success of the animal shelter in terms of locating an animal and rescuing it as well as being surrendered by their owners from different counties ?
Base level analysis of animals rescued from various counties.

Obviously Austin wins the race in terms of the best 'City' rescuing animals. But there are a substantial number of animals that have been rescued from other counties as well.

Travis county records the most rescues after Austin followed by Manor county. Also there are some animals (1.17%) that have been rescued 'Outside Jurisdiction'.

One out of five animals was rescued from counties other than Austin.
Also, we can say that 17% counts to the overall success of animal center in terms of :
Owner surrendering an animal to the center from counties other than Austin.
Carrying out the rescue operation away from Austin.
One of the important aspects to consider here is - Distance. So, I did some Feature Engineering to add a column containing distance in miles from that county to Austin.

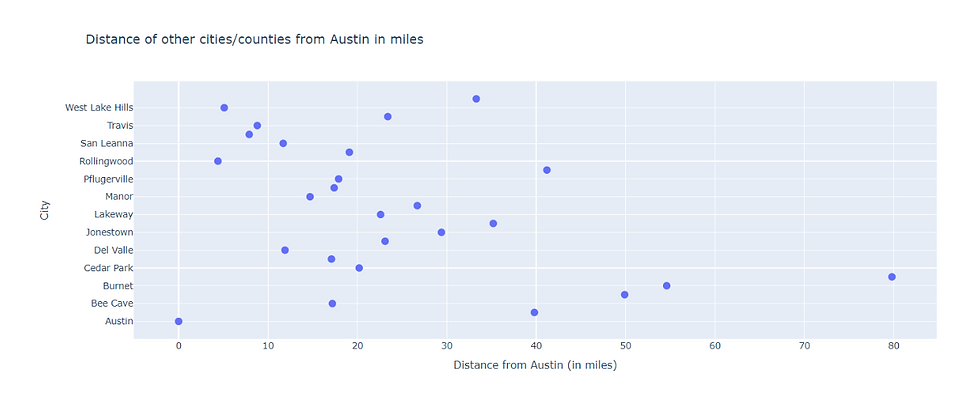
The average distance from where the animals were rescued was 25.3 miles.
Also, we can see that animals have been rescued or surrendered from counties greater than 50 miles of distance from Austin with the highest one being Caldwell county.
I decided to analyze the top 4 counties having the maximum distance from Austin - Caldwell, Burnet, Point Venture and Blanco counties.


More stray animals(13) rescued than owner surrendered(11) animals.
People from Burnet are the highest that have surrendered their animals to the center. This means people drove a distance of 54.6 miles to surrender their animals.
13 stray animals have been rescued from a distance of more than 40 miles. All this definitely counts towards the success of Austin Animal Center.
I also decided to check whether the center increased their number of rescue operations from these cities located far from Austin from 2014 to present.

From 2014 to 2022 there were no changes in the number of animals rescued or surrendered from these far located cities.
2) How has the pandemic influenced the adoption pattern in Austin?
Checking Adoption count over the years.

The adoption trend was almost constant from 2014 to 2018.
2019 was the best year for the animal center as it saw the most number of adoptions.
The number of adoptions were almost reduced to half in 2020(pandemic period) as compared to its most successfull year. This may due to the center's limited hours of operation.
Despite the complete lockdown state in the country there were still 4416 adoptions whcih still shows people are still interested in adopting. No effect of pandemic on adoption of animals.
The animal center bounced back in 2021 with increase in adoption rate.
Calculating adoption rate from 2019 to 2022.


Adoption Rate decreased by 47% for 19-20.
It increased by 39.13% fro 20-21.
The rate decreased as per graph for 21-22, but the values are not for the complete year.
Now I was interested to see whether pandemic played a role in adopting a different type of animal.

Adoption of Dogs and Cats follow a similiar trend till 2020.
Due to pandemic we see a huge dip in adoptions of both dogs and cats.
Cats were adopted more than dogs after the pandemic by 2%.
The pandemic saw no seapration between dogs and thier owners. Once everything started maybe dogs were affected more by separation anxiety. So cats were the preferred animal types for adoption after the pandemic.
Adoption trends for birds were constant before and after the pandemic.
Birds were the least preferred animal type for adoption.
I also checked the busiest months for adoption before and after Covid-19 for both cats and dogs.

December was the favorite month for the customers for adopting a dog before Covid.
People tend to adopt the most during Christmas (December) followed by Halloween (October).
After Covid more dogs were adopted during September and August. August 17th is celeberated as Clear the Shelter day.
July was the best month to adopt a cat for customers before Covid. Customers tend to adopt cats during Independence Day.
After Covid August became the busiest month for adopting cats.
Checking whether pandemic had an impact on age of adoption of animals.

The mean age (approx 23 months) for adopting a dog was same before and after Covid-19.
Same was also observed with cats with thier mean age of adoption being approximately 13 months.
Checking on breed patterns before and after Covid-19.


We see Chihuahua Shorthair Mix and Australian Cattle Dog Mix drop off the list after Covid-19.
Pitbull being one of the dangerous dog breeds to adopt still makes it to the list before as well as after Covid-19.

As we saw already, 2019 was the best year for the animal center as it saw the most number of adoptions thereby generating the highest revenue that year.
Almost constant revenue generation for 2016 to 2018.
Pandemic reduced the revenue generation by almost 50% as compared to 2019.
The animal center recovered pretty well after the pandemic in 2021 by generating $15k more as comapred to 2020.
3) Do older animals stay longer at the animal shelter and are less likely to get adopted?
Base level analysis of average time spent by all types of animals in the shelter.


Average time spent by dogs in the shelter is less as compared to that of cats.
Livestock spent the most time in the shelter.
People are hesitant to adopt livestock.
Also Livestock is an outlier as the number of livestock rescued or surrendered to the animal center as very less in number as compared to dogs and cats.
Performing some feature engineering to distinguish between young and old animals (cats and dogs). Dogs and cats were classified old if they were 6 years or above.


Clearly we can see that all old animals stay in the center for more days as compared to young animals and are less likely to get adopted.
People want to adopt young animals since they want to spend more time with them.
Also people want to train the animals when they are young and not an already trained old animal.
Comparatively old dogs spent more time in the center than old cats.
Both young and old cats get adopted quickly when compared to dogs.
Checking out the maximum number of days an old dog/cat and a young dog/cat stayed at the shelter.

Even though a young dog stayed at the center more than an old dog, the young dog is still 5 years old.
Maybe the breed or its nature could be one of the issues for adotping that young dog which stayed for maximum amount of time at the shelter.
Puppies and young dogs who were 1-2 years old never stayed at the center for a long time. They were adopted quicker compared to these old dogs.
Kittens always got adopted the fastest amongst dogs and cats.
Young Birds were adopted the fastest in all three animal types.
I hope you enjoyed the Report. Thank you!!


Comments